COMPUTATIONAL BIOLOGY · SCIENTIFIC ENGINEERING

Koen Reinders.

Groningen, Netherlands

I turn biological research questions into working systems—from simulation and machine learning to the software and hardware needed to collect reliable data.

Interested in research-engineering roles where models have to work outside a notebook.

01 / SELECTED WORK

Selected work.

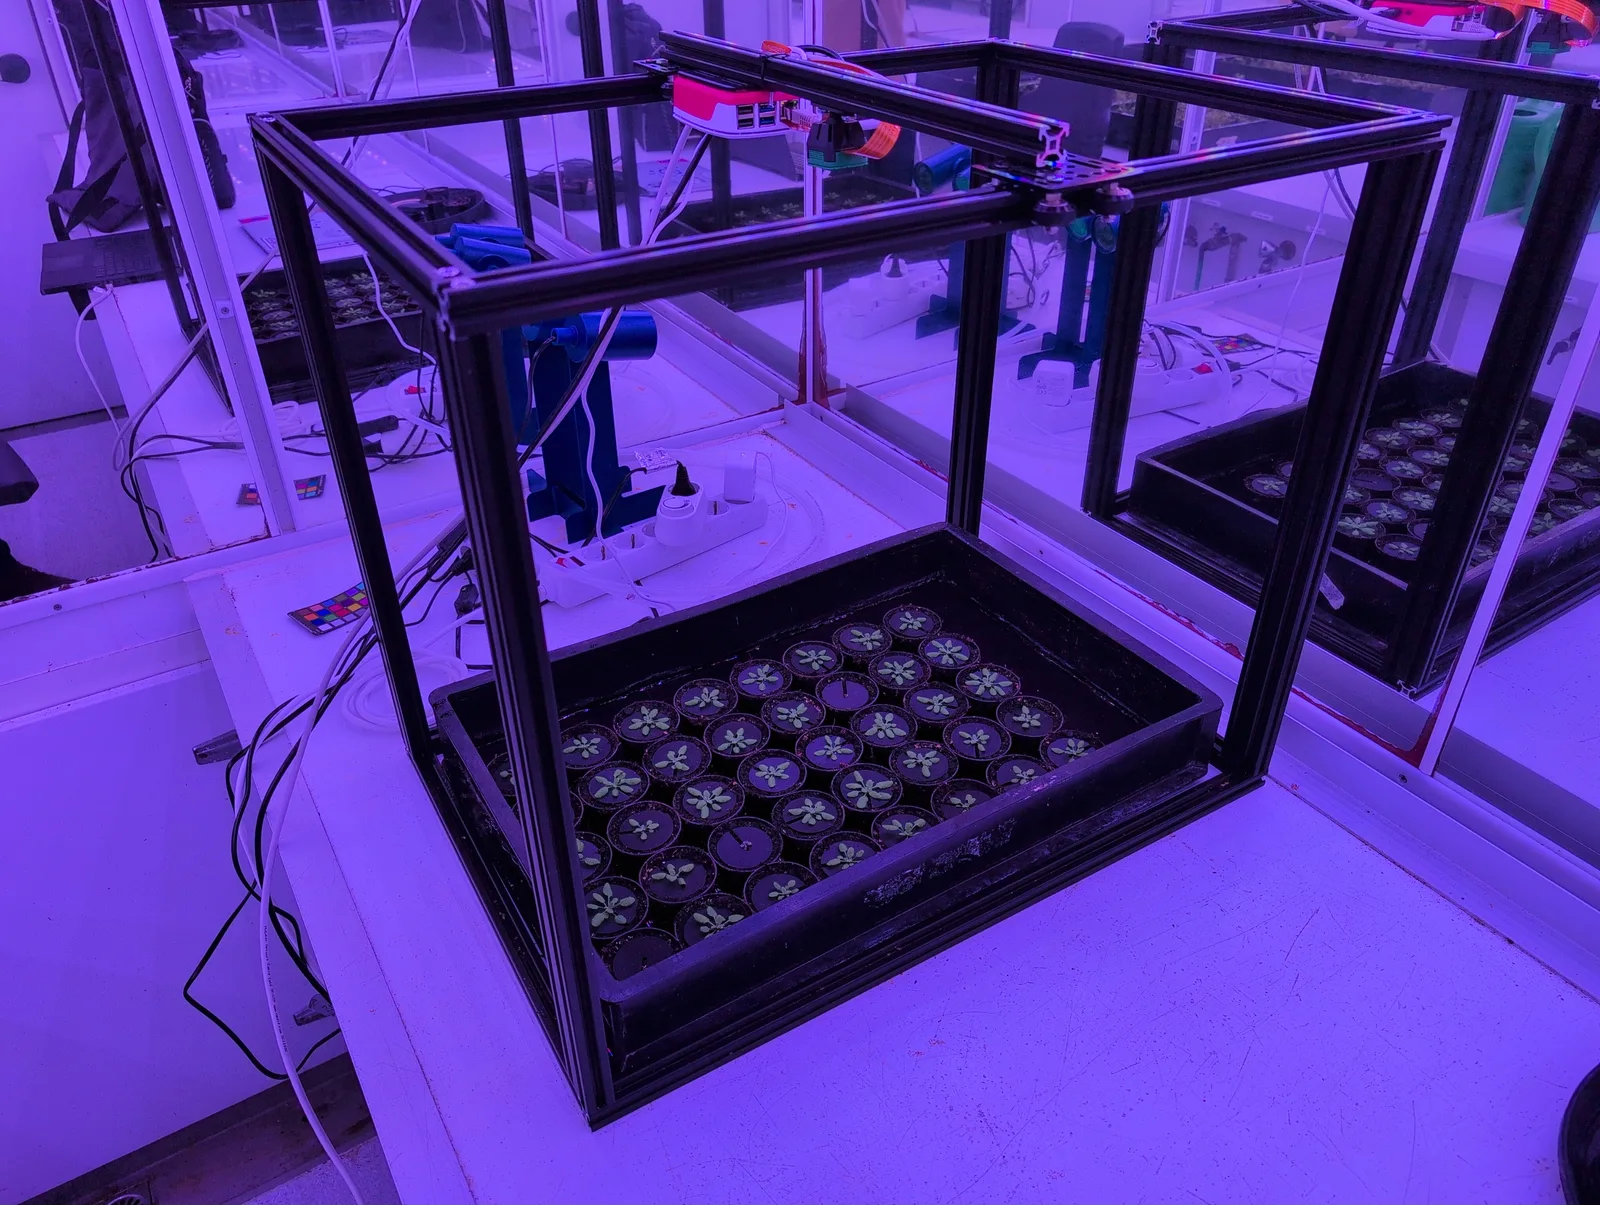
The Phenara plant phenotyping system in active research use above a tray of Arabidopsis plants
IN ACTIVE RESEARCH USE · PLANT BIOLOGY LAB
MSC RESEARCH / 2026 FEB—AUG 2026

Phenara.

Automated, time-resolved phenotyping of tray-grown plants.

My role: I designed and built the complete system: frame and camera geometry, Raspberry Pi acquisition, browser interface, scheduler, data model and canopy-analysis pipeline. Phenara is now used for research in the Plant Biology laboratory.

45plants
980time points
≈€400prototype cost
Engineering evidence
  • A guided calibration routine verifies camera alignment, tray regions and segmentation settings before activation
  • Reusable experiment configurations preserve schedules, capture settings and analysis calibration across comparable runs
  • Atomic image writes and append-only event logs create a traceable record of every scheduled capture and outcome
  • SQLite-backed jobs, schedule hashes and explicit misfire handling protect multi-day experiments across interruptions
Evaluation
  • All 45 plants were measured at each of 980 represented time points
  • Short-interval measurements were stable across 639 technical comparisons (RMSZ 0.093)
  • Mean projected canopy area rose from 2.58 to 31.22 cm² in the complete control run

What I learned: RGB drift over long experiments made fixed exposure, white balance and reference correction essential.

PythonReactOpenCVFreeCADRaspberry Pi
GitHub repository ↗
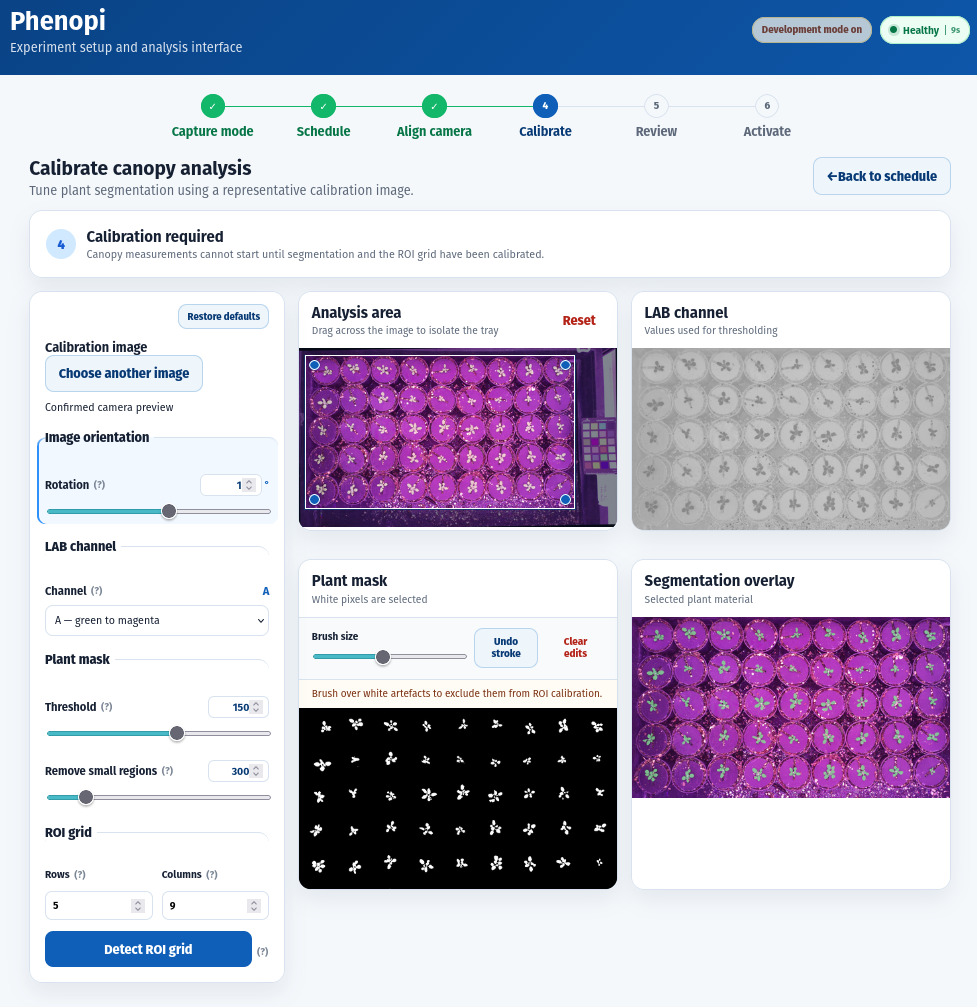
Phenara canopy-analysis calibration interface showing threshold and region controls
01 · CalibrateConfirm the camera, tray region and segmentation before a run begins.
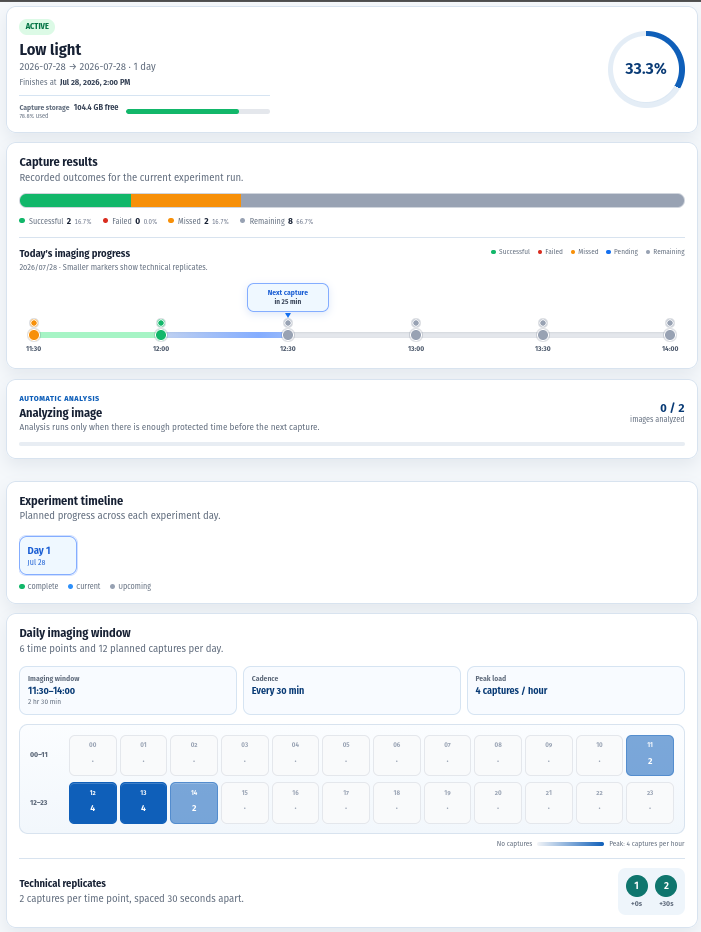
Phenara experiment dashboard showing capture progress and scheduler status
02 · MonitorInspect scheduler health, storage and individual capture outcomes.
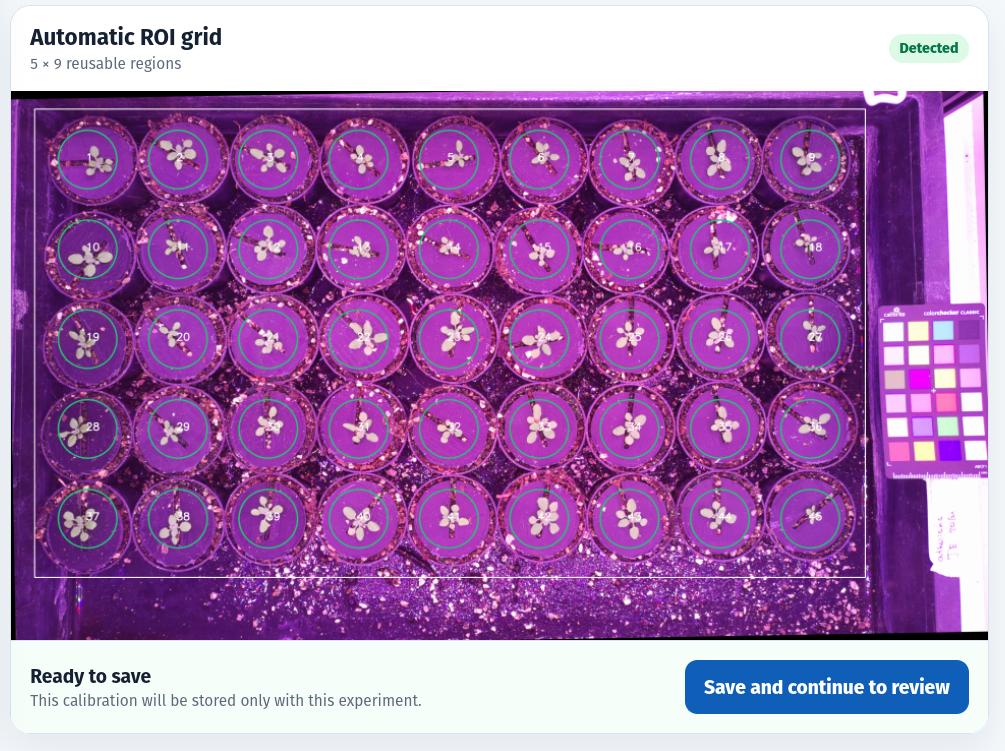
Phenara automatic plant region grid over an Arabidopsis tray image
03 · MeasureAssign segmented canopy measurements to reusable plant regions.
MASTER'S THESIS / 2025 APR—AUG 2025

Epidemiological
modelling.

Neural Networks for Estimating Disease Parameters from Incomplete Transmission Chains

Can useful disease parameters still be recovered when an outbreak is only partially observed?

My role: I designed and executed the full simulation study, built the restartable R/Python pipeline, trained and tuned the models, implemented the scarcity experiments, compared against ABC and interpreted the results.

Study design
  • 400,000 Latin-hypercube parameter sets simulated with an agent-based Ebola model
  • 33 timing, outcome and graph statistics extracted from each usable transmission chain
  • A deterministic 70/15/15 split kept the test set untouched during training, early stopping and Optuna tuning
  • Controlled node removal measured robustness to incomplete contact tracing; SHAP and perturbation tests exposed the signals used
400ksimulations attempted
138,259chains analysed
33summary statistics
Dataset details

Why 138,259? Of 400,000 simulations, 237,240 produced an outbreak. The analysis retained 138,259 chains with at least 2,000 hosts, where the summary statistics contained enough signal for inference.

Key results
  • R² 1.00Mean incubation time on the held-out test set
  • R² 0.98Infectivity and fatality probability on the held-out test set
  • Robust to 50% missingHigh-signal parameters stayed accurate as nodes were removed
  • Near-instant inferenceAfter four days of simulation and one day of training and tuning

The DNN achieved similar accuracy to ABC overall, with lower error for fatality probability and mean recovery time. Recovery time and incubation-time spread degraded first as data were removed.

Performance as outbreak data is removed0–80% nodes removed
Parameter inference performance under data scarcityLine chart of R squared for five epidemiological parameters as zero to eighty percent of transmission-chain nodes are removed.
Mean incubation
Infectivity
Fatality probability
Incubation spread
Mean recovery

Scope: the models were evaluated on simulated outbreaks with random missingness. Testing empirical surveillance data and realistic reporting biases is the next step.

PythonRPyTorchSLURMOptunaSHAP
02 / CAD PROJECTS

Designed in CAD.

Functional parts, fixtures and enclosures designed around real constraints. Drag to rotate; scroll or pinch to zoom.

Loading 3D modelDrag to rotate · scroll to zoom
REPAIR PART / 40 × 40 × 22 MM

Blender drive coupling

Designed to replace a failed coupling in a high-end blender. The fitted three-tooth part returned the machine to service instead of leaving it as electronic waste.

Loading 3D modelDrag to rotate · scroll to zoom
WOODWORKING TOOL / 200 × 200 × 100 MM

Shooting-board angle plate

An adjustable guide that holds a workpiece against a hand plane at a precise angle. Designed for accurate end-grain trimming with adjustments down to half a degree.

Loading 3D modelDrag to rotate · scroll to zoom
ENCLOSURE / 167 × 78 × 33 MM

Laptop charger enclosure

A compact enclosure study shaped around component packaging, access openings and a constrained footprint.

03 / BACKGROUND

Background.

2024—2026MSc Integrative BiologyUniversity of Groningen · 8.3/10 average
2025—2026Teaching Assistant, BiostatisticsUniversity of Groningen
2019—2024BSc Molecular BiologyUniversity of Groningen · thesis using GROMACS
2018—2023Volunteer science & nature educatorIVN · experiments, microscopy and field activities
Python / R / PyTorchOpenCV / ReactLinux / SLURMFreeCAD / 3D printingRaspberry Pi
04 / CONTACT

Contact.

koenf.reinders@gmail.com ↗